Sometimes online gaming statistics are a good starting point if you want to find out how you can improve yourself and sometimes they are simply overrated. Maybe efficiency is important and a high frag count impressing, but if your team loses nobody cares about a 5:1 frag/death ratio. So always take them with a grain of salt.
There are daily graphs for Minetest created by Munin which represent the number of players on the server and the lag.
The statistics are created by a Python script called pyqscore. It's exactly what I have been looking for because setting up a MySQL Server + PHP for parsing a log file is simply overkill. Besides pyqscore is free software and easy to adjust to your needs presenting all important OpenArena facts. Thumbs up and thanks for creating it.
You can watch the data of the last 24 hours and you can also study the
aggregated numbers of the current month. At the beginning of the next month all
data will be deleted and everything starts over again.
Note: Pyqscore counts all frags and does not exclude bot frags.
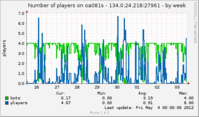
Another page shows the number of players per day, week, month and year. All graphs are generated by Munin with support from qstat.
Due to the openness of the server, tracking statistics is rather futile. Whereas observing the utilization of the server and the number of players playing on it might be useful in the long run.
The server is intended for public use. Everyone who gains master can change maps and game types thus displaying statistics is troublesome and most likely unnecessary. If you are being interested to know when and how many people join the server, check out the players graph.
Similar facts apply to the Teeworlds classic server. Graphs are also available.
